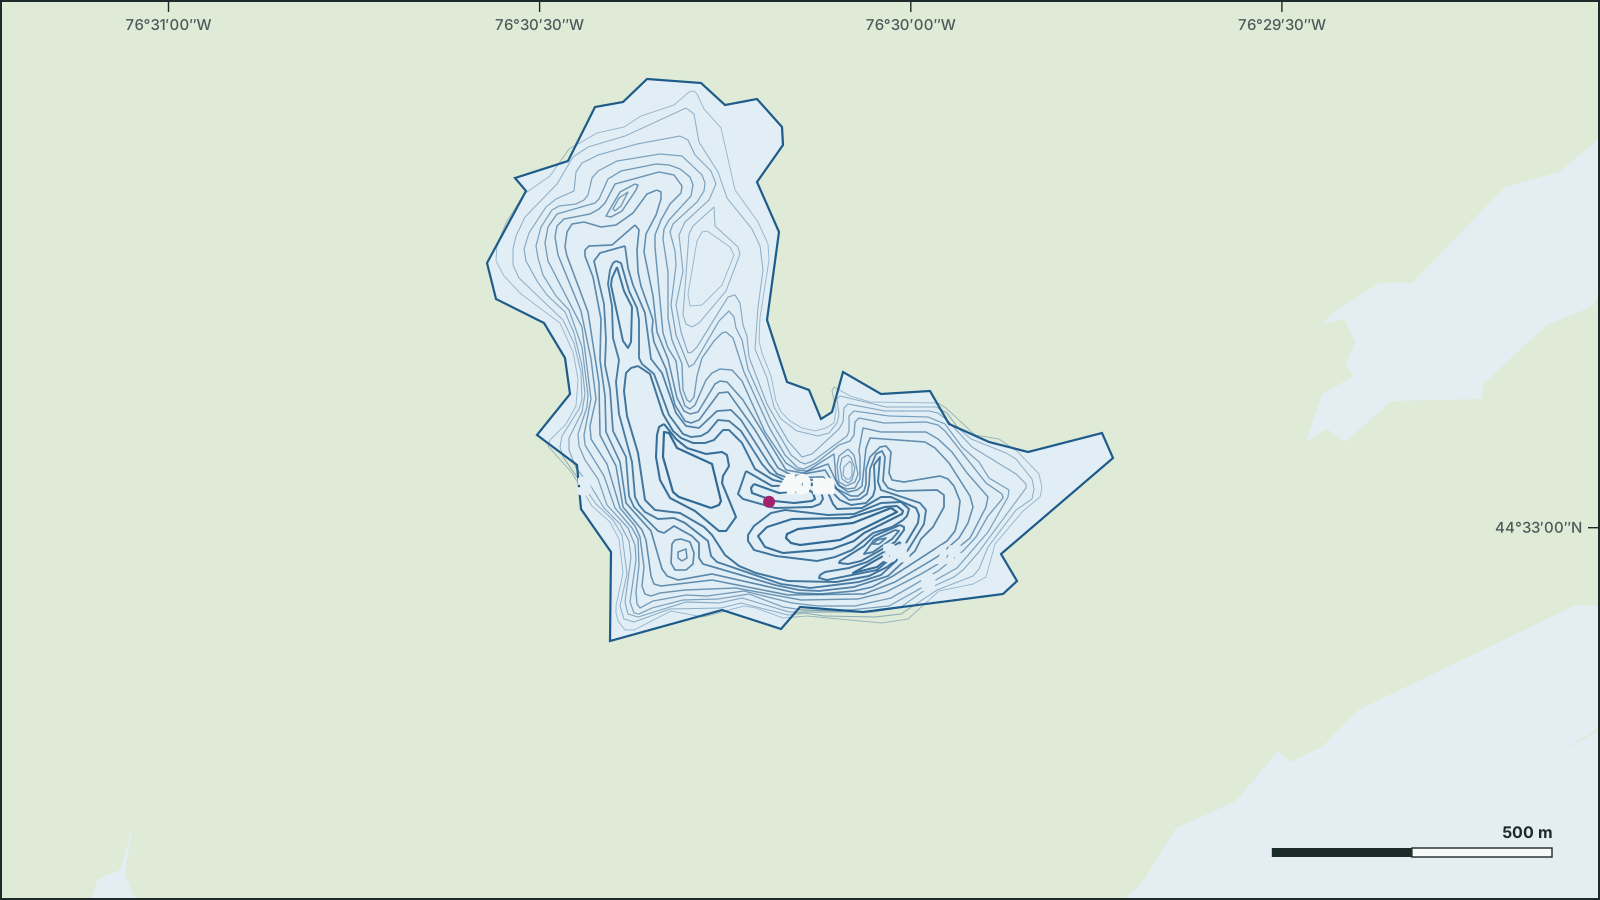
Little Clear Lake
44.5515° N, 76.5047° W
Depth contours from the 1967 government survey. Not for navigation.
Download the depth map (SVG)Little Clear Lake, Ontario. 44.5515° N, 76.5047° W
Maximum depth 39.6 m (1967 survey). Scale bar on the map.
Not for navigation. Depths are from government surveys and may be outdated.
borealbound.ca/lakes/on/little-clear-lake/, compiled October 9, 2026
- Canadian Geographical Names Database, Natural Resources Canada. Contains information licensed under the Open Government Licence – Canada.
- HydroLAKES v1.0, Messager et al. 2016 / WWF HydroSHEDS. Licensed under CC BY 4.0.
- Census boundaries and population, 2021, Statistics Canada. Adapted from Statistics Canada. This does not constitute an endorsement by Statistics Canada.
- Fisheries Management Zones, Ontario Ministry of Natural Resources. Contains information licensed under the Open Government Licence – Ontario.
- Bathymetry lines and survey index, Ontario Ministry of Natural Resources. Contains information licensed under the Open Government Licence – Ontario.
- City page weather forecasts and alerts, Environment and Climate Change Canada. Contains data from Environment and Climate Change Canada (ECCC Data Servers End-use Licence).
- Air Quality Health Index observations and forecasts, Environment and Climate Change Canada. Contains data from Environment and Climate Change Canada (ECCC Data Servers End-use Licence).
- Guide to Eating Ontario Fish: Advisory Database, Ontario Ministry of the Environment, Conservation and Parks. Contains information licensed under the Open Government Licence – Ontario.
Little Clear Lake is 39.6 m deep at its deepest point, deeper than 88% of the 2,688 surveyed lakes in Ontario. It covers 0.53 km² and lies 4.4 km west of Buck Lake.
- Maximum depth
- 39.6 msurveyed 1967
- deeper than 88% of the 2,688 surveyed lakes in Ontario
- Area
- 0.53 km²
- larger than 52% of the 18,731 lakes in Ontario
- Shoreline
- 3.9 km
- shorter than 62% of the 18,731 lakes in Ontario
- Elevation
- 164 m
Today on the water
7.9 °C
Observed at Westport, as of 7:00 a.m. EDT
choppy Estimated waves, next 12 hours: up to 0.2 m. Around 12 p.m., wind from the northwest: the northwest shore is sheltered, waves build toward the southeast shore.
| Time | 8 a.m. | 11 a.m. | 2 p.m. | 5 p.m. | 8 p.m. | 11 p.m. | 2 a.m. | 5 a.m. |
|---|---|---|---|---|---|---|---|---|
| Wind km/h | W 15 | W 15 | NW 30 | NW 30 | NW 15 | var. 5 | var. 5 | var. 5 |
| Gusts km/h | 50 | 50 | ||||||
| Waves (est.) m | 0.1 | 0.1 | 0.2 | 0.2 | 0.1 | |||
| Temp. °C | 6 | 10 | 13 | 14 | 10 | 5 | 2 | 1 |
| Precip. % | 40 | 40 | 40 | 40 | 20 | 20 | 0 | 0 |
Today: A mix of sun and cloud with 40 percent chance of showers. Wind becoming northwest 30 km/h gusting to 50 near noon. High 14. UV index 4 or moderate.
Weather: Westport (local forecast), as of 7:03 a.m. EDT
Sun and moon
- Civil dawn
- 6:44 a.m.
- Sunrise
- 7:13 a.m.
- Sunset
- 6:31 p.m.
- Civil dusk
- 7:01 p.m.
- Moonrise
- 6:05 a.m.
- Moonset
- 5:50 p.m.
- Moon
- Waning crescent, 1% lit
Air Quality Health Index
1 low risk
Kingston, as of 7:00 a.m. EDT
Depth
42% of Little Clear Lake is deeper than 20 m.
How to read it: the lake’s area is sorted from the shore to the deepest point. Where the curve is flat, large areas share one depth (flats and weed beds); where it drops, depth changes quickly (drop-offs).
The government depth survey from 1967 records a maximum depth of 39.6 m, drawn from 33 depth contours.
- Download the depth map (SVG)Printing this page gives the map on one sheet, with scale and sources.
Not for navigation. Depths are from government surveys and may be outdated.