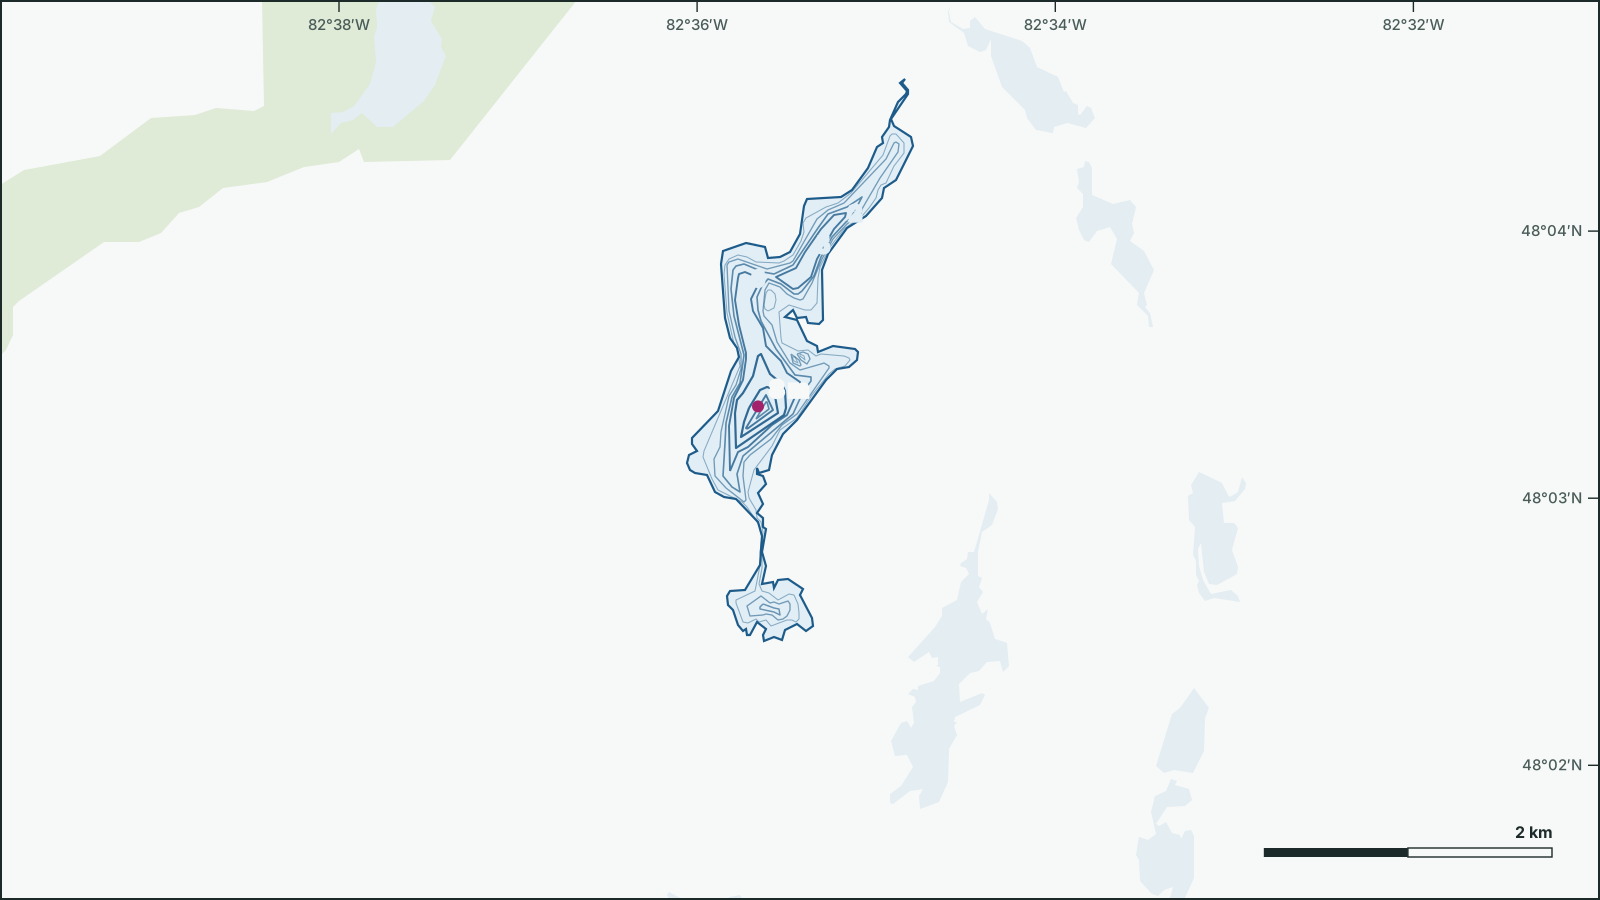
Tom Smith Lake
48.0581° N, 82.5923° W
Depth contours from the 1961 government survey. Not for navigation.
Download the depth map (SVG)Tom Smith Lake, Ontario. 48.0581° N, 82.5923° W
Maximum depth 7.6 m (1961 survey). Scale bar on the map.
Not for navigation. Depths are from government surveys and may be outdated.
borealbound.ca/lakes/on/tom-smith-lake/, compiled October 9, 2026
- Canadian Geographical Names Database, Natural Resources Canada. Contains information licensed under the Open Government Licence – Canada.
- HydroLAKES v1.0, Messager et al. 2016 / WWF HydroSHEDS. Licensed under CC BY 4.0.
- Census boundaries and population, 2021, Statistics Canada. Adapted from Statistics Canada. This does not constitute an endorsement by Statistics Canada.
- Aquatic Resource Area survey points, Ontario Ministry of Natural Resources. Contains information licensed under the Open Government Licence – Ontario.
- Fisheries Management Zones, Ontario Ministry of Natural Resources. Contains information licensed under the Open Government Licence – Ontario.
- Bathymetry lines and survey index, Ontario Ministry of Natural Resources. Contains information licensed under the Open Government Licence – Ontario.
Tom Smith Lake is 7.6 m deep at its deepest point, shallower than 80% of the 2,688 surveyed lakes in Ontario. It covers 1.5 km² and lies 22 km south of Foleyet.
Government surveys have recorded 1 fish species here: brook trout.
- Maximum depth
- 7.6 msurveyed 1961
- shallower than 80% of the 2,688 surveyed lakes in Ontario
- Area
- 1.5 km²
- larger than 76% of the 18,731 lakes in Ontario
- Shoreline
- 12.1 km
- longer than 78% of the 18,731 lakes in Ontario
- Fish species
- 1
- fewer than 100% of the 2,454 surveyed lakes in Ontario
- Elevation
- 412 m
Sun and moon today
- Civil dawn
- 7:10 a.m.
- Sunrise
- 7:41 a.m.
- Sunset
- 6:53 p.m.
- Civil dusk
- 7:24 p.m.
- Moonrise
- 6:32 a.m.
- Moonset
- 6:11 p.m.
- Moon
- Waning crescent, 1% lit
Depth
49% of Tom Smith Lake is shallower than 3 m.
How to read it: the lake’s area is sorted from the shore to the deepest point. Where the curve is flat, large areas share one depth (flats and weed beds); where it drops, depth changes quickly (drop-offs).
The government depth survey from 1961 records a maximum depth of 7.6 m, drawn from 16 depth contours.
- Download the depth map (SVG)Printing this page gives the map on one sheet, with scale and sources.
Not for navigation. Depths are from government surveys and may be outdated.
Fish
Sport fish by the share of the 1 government surveys that recorded them.
Fishing regulations: Fisheries Management Zone 8. Check seasons and limits before you fish.