Watabeag Lake
48.2471° N, 80.5558° W
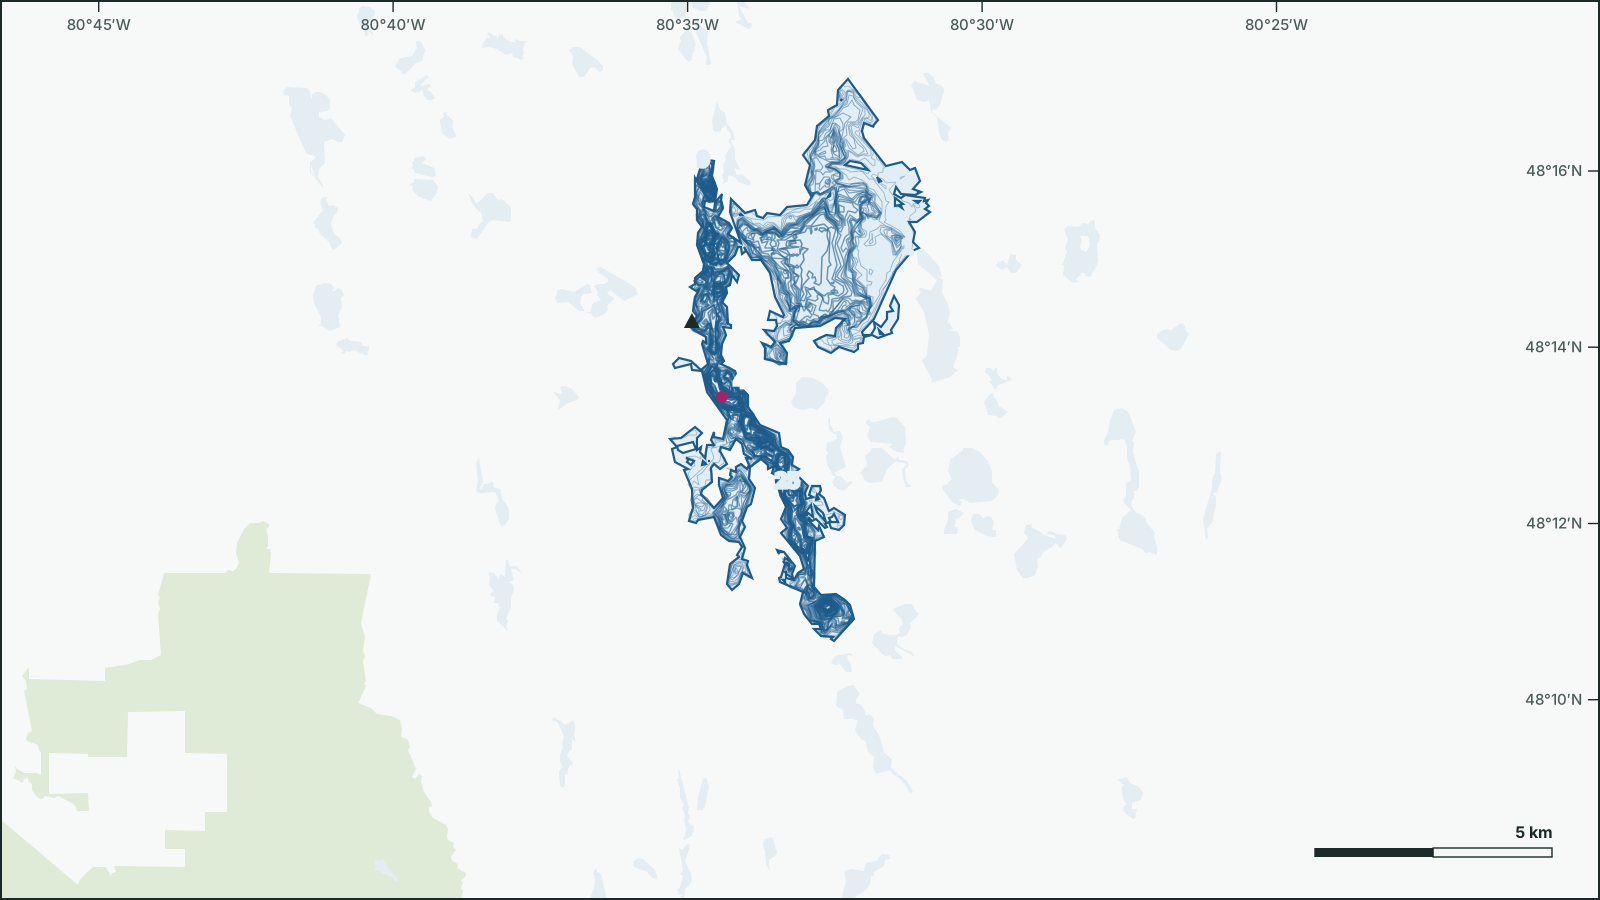
Depth contours from the 2003 government survey. Not for navigation.
Download the depth map (SVG)Watabeag Lake, Ontario. 48.2471° N, 80.5558° W
Maximum depth 41 m (2003 survey). Scale bar on the map.
Not for navigation. Depths are from government surveys and may be outdated.
borealbound.ca/lakes/on/watabeag-lake/, compiled October 9, 2026
- Canadian Geographical Names Database, Natural Resources Canada. Contains information licensed under the Open Government Licence – Canada.
- HydroLAKES v1.0, Messager et al. 2016 / WWF HydroSHEDS. Licensed under CC BY 4.0.
- Census boundaries and population, 2021, Statistics Canada. Adapted from Statistics Canada. This does not constitute an endorsement by Statistics Canada.
- Aquatic Resource Area survey points, Ontario Ministry of Natural Resources. Contains information licensed under the Open Government Licence – Ontario.
- Fishing access points, Ontario Ministry of Natural Resources. Contains information licensed under the Open Government Licence – Ontario.
- Fisheries Management Zones, Ontario Ministry of Natural Resources. Contains information licensed under the Open Government Licence – Ontario.
- Lake Partner Program, Ontario Ministry of the Environment, Conservation and Parks. Contains information licensed under the Open Government Licence – Ontario.
- Bathymetry lines and survey index, Ontario Ministry of Natural Resources. Contains information licensed under the Open Government Licence – Ontario.
- Real-time hydrometric data, Environment and Climate Change Canada. Contains data from Environment and Climate Change Canada (ECCC Data Servers End-use Licence).
- National Water Data Archive (HYDAT) daily means, Environment and Climate Change Canada. Contains data from Environment and Climate Change Canada (ECCC Data Servers End-use Licence).
- City page weather forecasts and alerts, Environment and Climate Change Canada. Contains data from Environment and Climate Change Canada (ECCC Data Servers End-use Licence).
- Guide to Eating Ontario Fish: Advisory Database, Ontario Ministry of the Environment, Conservation and Parks. Contains information licensed under the Open Government Licence – Ontario.
- Ontario Waterbody Location Identifier, Ontario Ministry of Natural Resources. Contains information licensed under the Open Government Licence – Ontario.
Watabeag Lake is 41 m deep at its deepest point, deeper than 89% of the 2,688 surveyed lakes in Ontario. It covers 20.7 km² and lies 23 km southwest of Ramore.
Government surveys have recorded 16 fish species here, including yellow perch, cisco and lake whitefish.
- Maximum depth
- 41 msurveyed 2003
- deeper than 89% of the 2,688 surveyed lakes in Ontario
- Area
- 20.7 km²
- larger than 98% of the 18,731 lakes in Ontario
- Shoreline
- 86.9 km
- longer than 98% of the 18,731 lakes in Ontario
- Water clarity
- 1.8 mSecchi depth, 2019
- less clear than 90% of the 1,251 monitored lakes in Ontario
- Fish species
- 16
- more than 91% of the 2,454 surveyed lakes in Ontario
- Elevation
- 316 m
Today on the water
4.4 °C
Observed at Kirkland Lake, as of 9:00 a.m. EDT
choppy Estimated waves, next 12 hours: up to 0.3 m. Around 11 a.m., wind from the northwest: the northwest shore is sheltered, waves build toward the southeast shore.
| Time | 10 a.m. | 1 p.m. | 4 p.m. | 7 p.m. | 10 p.m. | 1 a.m. | 4 a.m. | 7 a.m. |
|---|---|---|---|---|---|---|---|---|
| Wind km/h | NW 15 | NW 20 | NW 20 | NW 20 | var. 5 | SE 10 | SE 10 | SE 10 |
| Gusts km/h | 40 | 40 | 40 | |||||
| Waves (est.) m | 0.2 | 0.3 | 0.3 | 0.3 | ||||
| Temp. °C | 5 | 8 | 9 | 6 | 3 | 1 | -2 | -2 |
| Precip. % | 30 | 30 | 20 | 0 | 0 | 0 | 0 | 0 |
Today: Cloudy with 30 percent chance of showers this morning and early this afternoon then a mix of sun and cloud. Wind becoming northwest 20 km/h gusting to 40 late this morning. High 9. UV index 2 or low.
Weather: Kirkland Lake (local forecast), as of 9:02 a.m. EDT
Water level
Watabeag Lake at Watabeag Lake Dam: 316.91 m at 7:20 a.m. EDT: 8 cm below the median for this time of year, within the normal range.
Normal range (25th–75th percentile, HYDAT) Last 7 days
Provisional real-time data, subject to revision. hydrometric station 04MB005
Sun and moon
- Civil dawn
- 7:01 a.m.
- Sunrise
- 7:33 a.m.
- Sunset
- 6:44 p.m.
- Civil dusk
- 7:16 p.m.
- Moonrise
- 6:24 a.m.
- Moonset
- 6:03 p.m.
- Moon
- Waning crescent, 1% lit
Depth
17% of Watabeag Lake is deeper than 20 m.
How to read it: the lake’s area is sorted from the shore to the deepest point. Where the curve is flat, large areas share one depth (flats and weed beds); where it drops, depth changes quickly (drop-offs).
The government depth survey from 2003 records a maximum depth of 41 m, drawn from 1,500 depth contours.
- Download the depth map (SVG)Printing this page gives the map on one sheet, with scale and sources.
Not for navigation. Depths are from government surveys and may be outdated.
Fish
Sport fish by the share of the 34 government surveys (2010–2010) that recorded them.
Forage fish and other species (10)
Forage fish
- Spottail Shiner 10
- Logperch 6
- Trout-Perch 6
- Blacknose Shiner 5
- Northern Pearl Dace 4
- Common Shiner 3
- Rainbow Smelt 3
- Spoonhead Sculpin 3
- Northern Redbelly Dace 1
Other
- White Sucker 22
Numbers are the surveys that recorded each species.
Eating your catch
The provincial guide to eating fish (2026) sets limits for 3 species from Watabeag Lake. Maximum meals per month:
| Species | Length | General population | Sensitive population* | Contaminant |
|---|---|---|---|---|
| Lake Trout | 50-55 cm | 12 | 4 | Mercury |
| Northern Pike | 55-60 cm | 12 | 4 | Mercury |
| Walleye | 55-60 cm | 4 | Do not eat | Mercury |
* As defined in the guide, including children and people who are or may become pregnant. Limits are for the length the guide lists most often; they change with the size of the fish. Read the official guide
Fishing regulations: Fisheries Management Zone 8. Check seasons and limits before you fish.
Water
Clarity was measured with a Secchi disk in 3 years between 2003 and 2019; the latest annual mean is 1.8 m.
Getting on the water
1 listed boat launch. marks launches on the map.
- Sanborn Creek Access (watabeag Lake)